Trade Cost Measurement
Trading costs are either explicit in that they are easily visible or implicit in that they are embedded in the transaction. Total costs of trading can be measured using implementation shortfall (IS). At the highest level, the absolute value of IS is calculated as:
- IS = paper return − actual return
The paper return shows the hypothetical return that the fund would have received if the manager were able to transact all shares at the desired decision price and without any associated costs or fees (i.e., with no friction):
- Paper return = (Pn – Pd)(S) = (S)(Pn) – (S)(Pd)
VOCAB: The decision price is the literal price of the security when the decision to buy or sell a security was made. It is not the initial limit price or the price at the time the order was released.
The actual portfolio return of the portfolio is net of all costs. The difference between these two amounts is the total cost of executing the trade.

Here, sj and pj represent the number of shares executed and the transaction price of the jth trade, respectively, (∑sj) represents the total number of shares of the order that were executed in the market, and Fees includes all costs paid by the fund to complete the order.
Usually, IS is expressed as basis points of the total cost of the paper portfolio.
IS can be decomposed into the following parts:
- Execution cost occurs due to executing shares at a less favorable price than the original decision price. Execution cost can be further broken down into delay cost and trading cost.
- Delay cost is due to adverse price movements in the time between the portfolio manager submitting the order to the trader and the time the trader releases it to the market. This delay is usually due to the time it takes the trading desk to determine the optimal execution strategy for the trade.
- Trading cost is due to the market impact of executing the trade.
- Opportunity cost is the cost of not trading any unfilled part of the order. Recall that the paper portfolio assumes that all shares are executed immediately at the original decision price—the actual trade may have only filled part of the order, and the lost profit on the unfilled portion is the opportunity cost.
- Fixed fees are any explicit commissions or fees incurred in executing the trade.
The expanded implementation shortfall can be broken down as follows:
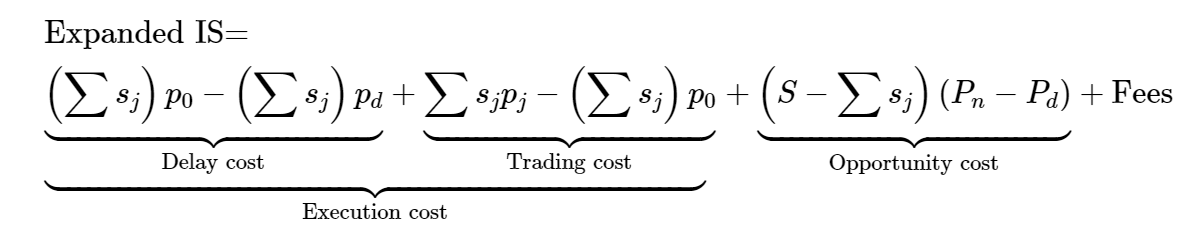
Delay costs arise due to adverse price movement during the interval between the trader receiving an order from the portfolio manager and passing it on to a broker/market. Delay costs can be minimized with efficient trading practices to give traders the pretrade and posttrade analysis they need to make a swift decision on an optimal trading strategy.
A detailed analysis of opportunity cost can help managers deploy unused cash into the next-most attractive investment, thereby reducing the impact of opportunity cost on the portfolio.
Analysis of trading (market impact) costs can also help traders establish proper price benchmarks and appropriate urgency of trade.
Evaluating Trade Execution
Trade cost analysis is vital for portfolio managers to be able to assess the effectiveness of brokers, algorithms, and other strategies.
Costs are evaluated versus specified price benchmarks, which vary depending upon the objectives of the manager/nature of the order. This benchmark price could be an arrival price, VWAP, TWAP, or the closing market price. There can even be more than one relevant benchmark if the strategy has several objectives.
In general, buyers incur costs if they execute trades above relevant benchmark prices, while sellers incur costs if they execute below relevant benchmark prices. Trade costs are calculated such that a positive value represents underperformance against the benchmark, and can generally be formulated as follows:
- absolute cost ($) = side × (execution price − benchmark price) × shares executed
where:
side = +1 for a buy order, –1 for a sell order
These costs are often expressed in basis points of the original benchmark price, using the following expression:

For instance is using VWAP as benchmark:

Regardless of the skill of the trader, buy orders in a rising market and sell orders in a falling market incur positive trading costs due to adverse price movements.
To remove the impact of market movements on trade cost, traders can use market-adjusted cost. The market-adjusted costs ensure a trader is not penalized or rewarded for general market movements over the trade horizon by subtracting the index cost adjusted for the security’s beta.
The index cost is a representation of the costs due to general market index movements, and is calculated as follows:

The market-adjusted cost of the trade is given by the following expression:
- market-adjusted cost (bps) = arrival cost (bps) − β × index cost (bps)
where:
- arrival cost = the arrival cost of the trade based on an arrival price benchmark
β = beta of the security versus the index used to calculate index cost
Another methodology used by investors to evaluate trading performance is to compare the arrival cost of the order with the estimated pre-trade cost.
The expected trading cost is calculated using a pre-trade model and incorporates such factors as order size, volatility, market liquidity, investor risk aversion, level of urgency , and the underlying market conditions at the time of the trade. If a fund executes at a cost lower than the pre-trade estimate, it is typically considered superior trade performance. If the order is executed at a cost higher than the pre-trade cost benchmark, then the trade is considered to have underperformed expectations.
This metric helps fund managers understand the value added by their broker and/or execution algorithms during the execution of the order. The added value metric is computed as follows:
- Added value (bps) = Arrival cost (bps) – Est. pre-trade cost (bps)
Comparing IS to VWAP
Implementation shortfall (IS) measures the total impact of portfolio performance attributable to implementation costs. This measure compares actual portfolio performance to a hypothetical portfolio based on the value of positions when decisions are reached.
Volume-weighted average price (VWAP) is the average price (weighted for corresponding volume) at which a security trades during any given day. It is used as a benchmark measure for evaluating trading costs.
Two disadvantages of IS are:
- This measure requires more extensive transaction data to evaluate the trading transactions.
- It uses a potentially unfamiliar framework to evaluate traders.
Two advantages of VWAP are:
- This measure is simple to compute and easy to understand.
- It is useful for evaluating small trades.
Two disadvantages of VWAP are:
- It can result in gaming by delaying trade placement when market prices do not compare favorably to VWAP.
- This measure ignores opportunity costs if orders are not filled.