
Investment performance appraisal identifies and measures investment skill, providing the information to assess how effectively money has been invested given the risks that were taken.
Performance appraisal is most often concerned with ranking investment managers who follow similar investment disciplines.
Return attribution provides information that can complement a performance appraisal analysis by providing more details about the consequences of managerial decisions. Performance attribution identifies and quantifies the sources of added value, whereas performance appraisal seeks to ascertain whether added value was a result of managerial skill.
An investment manager’s record for any specific period will reflect good luck (unanticipated good developments) and bad luck (unanticipated bad developments). Deciding whether a portfolio manager has or lacks active investment skill on the basis of past returns is difficult and always subject to error. Financial market returns have a large element of randomness.
Appraisal Measures
Sharpe ratio
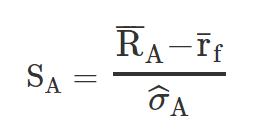
The Sharpe ratio is calculated as the incremental or excess return over the risk-free rate divided by standard deviation. A key drawback with the ratio is that the denominator does not differentiate between volatility that is upside versus downside.
Treynor ratio
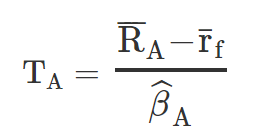
The Treynor ratio is similar to the Sharpe ratio, but the denominator for the former is measured by beta, so it only considers systematic risk rather than total risk like the latter. Therefore, with the Treynor ratio, the universe of appropriate benchmarks is limited to only those that assume efficient markets. The Treynor ratio is only useful in evaluating portfolios that have systematic risk and do not have unsystematic risk; in other words, such portfolios are well diversified.
Information ratio
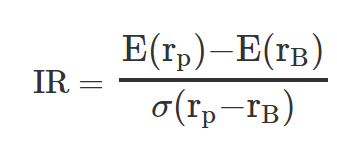
The information ratio (IR) is used to measure a portfolio’s performance against the benchmark but accounts for differences in risk. The numerator is the difference between the mean returns of the portfolio and the benchmark, respectively. The denominator is known as the tracking risk, or the variability in the portfolio performance with that of its benchmark.
Certainty Equivalent Return
- Certainty Equivalent Return = Expected Portfolio Return – 0.5(Risk Aversion)(Portfolio Variance)
Higher return is better.
Appraisal ratio
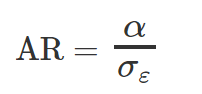
The appraisal ratio (AR) is calculated as alpha divided by the standard deviation of the residual/unsystematic risk (otherwise known as the standard error of regression). Alpha is excess return, which is calculated as the return earned by the portfolio minus the return suggested by CAPM.
The AR is the ratio of returns from active management over risks of active management.
The Sortino ratio only considers the standard deviation of the downside risk. Clients tend to be more concerned about volatility associated with negative returns. As a result, the Sortino ratio can provide a more meaningful view of a portfolio’s risk-adjusted performance than the Sharpe ratio.
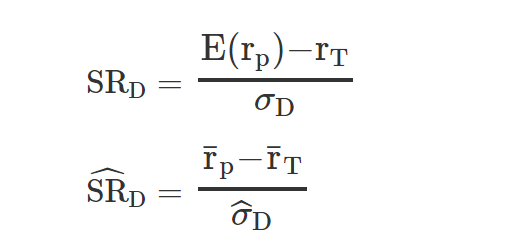
The rT refers to the MAR, or target rate of return, and the σD refers to target semi-standard deviation, or target semideviation. In other words, the Sortino ratio penalizes managers only for “bad” volatility by considering only returns below the MAR.
Similar to the Sharpe ratio, the higher the Sortino ratio, the better the risk-adjusted performance.
The Sortino ratio is more appropriate for investments with non-normal (nonsymmetrical) return distributions. Therefore, for investments that have nonsymmetrical or skewed return distributions, such as hedge funds or options, the Sortino ratio appears to be a more appropriate performance metric. However, a comparability problem exists with the Sortino ratio because the determination of MAR is subjective and specific to each investor.
Capture ratios determine the manager’s relative performance when markets are up or down.
A capture ratio of 1 is indicative of a symmetrical return profile. Therefore, if the capture ratio > 1, then there is a positively asymmetrical (convex) return profile in that there is greater upside capture than downside capture. Correspondingly, if the capture ratio < 1, there is a negatively asymmetrical (concave) return profile in that there is greater downside capture than upside capture.
Ideally, the manager would capture as much of the upside as possible and capture as little of the downside as possible to maximize the capture ratio.
Drawdown duration is the total time required to fully recover a drawdown; it is from when the drawdown commences up to when the cumulative drawdown is zero. Drawdown duration can be subdivided into a drawdown phase and a recovery phase. Maximum drawdown occurs at the very end of the drawdown phase and at the very start of the recovery phase; it is the point at which the cumulative drawdown is at its highest.
| Profile | Upside Capture | Downside Capture | Ratio |
|---|---|---|---|
| Long only | 100% | 100% | 1.0 |
| Positive asymmetry | 75% | 25% | 3.0 |
| Low beta | 50% | 50% | 1.0 |
| Negative asymmetry | 25% | 75% | 0.3 |