
Risk budgeting is a process by which the total risk appetite of the portfolio is allocated among the various components of portfolio choice.
An effective risk management process requires that the portfolio manager do the following:
- Determine which type of risk measure is most appropriate to her strategy.
- Absolute risk measures are appropriate when the investment objective is expressed in terms of total returns
- Relative risk measures are appropriate when the investment objective is to outperform a market index
- Understand how each aspect of the strategy contributes to its overall risk.
- Determine what level of risk budget is appropriate.
- Properly allocate risk among individual positions/factors.
Causes and Sources of Absolute Risk
Absolute risk measures focus on the size and composition of absolute portfolio variance (i.e., without reference to any benchmark variance).
The contribution of asset i to portfolio variance (CVi) is given by the equation:
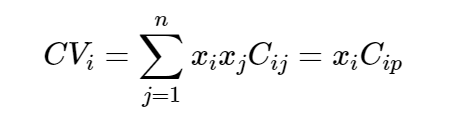
where
xj = the asset’s weight in the portfolio
Cij = the covariance of returns between asset i and asset j
Cip = the covariance of returns between asset i and the portfolio
The contribution of an asset to total portfolio variance is equal to the product of the weight of the asset and its covariance with the entire portfolio.
A manager that generates most of their returns from exposure to rewarded factors (such as a multi-factor diversified manager) would expect to see a large contribution to risk explained by rewarded factors and a low contribution to risk from unexplained idiosyncratic risks.
Causes and Sources of Relative/Active Risk
Relative risk becomes an appropriate measure when the manager is concerned with her performance relative to a benchmark.

where RCip is the covariance of relative returns between asset i and the portfolio.
If you are assessing risk using a relative risk construct, you can no longer assume that a lower-risk asset reduces active risk or that a higher-risk asset increases it. In fact, depending on the composition of the benchmark, a lower-risk asset could increase active risk whereas a higher-risk asset might reduce it.
The important points to note are:
- Contribution to active variance is a function of active risk not absolute standard deviation. While cash has a very low standard deviation, it has an active risk twice that of the indexes comprising the benchmark due to the low correlation of cash versus the benchmark. This leads to cash contributing to 100% of the active variance.
- The correlation of the active returns of index A and index B is –1. This is because the benchmark is an equally weighted average of the two indices—when one is outperforming the benchmark (so has positive active returns) then the other must be underperforming the benchmark (giving negative active returns).
Determining the Appropriate Level of Risk
Practical considerations when considering the appropriate level of portfolio risk include:
- Implementation constraints. Constraints on short positions or on leverage may limit the manager’s ability to under/overweight. Liquidity issues may increase costs as a manager increases active risk, which leads to a degradation of the information ratio as the extra costs weigh on active returns.
- Limited diversification opportunities. Portfolios with higher risk/return targets eventually run out of high-return investment opportunities and lose the ability to diversify efficiently, thereby reducing the Sharpe ratio.
- Leverage and its implications for risk. While leverage could be used to solve issue number two in a single period (allowing the portfolio to move up the linear capital allocation line, rather than following the curved efficient frontier), too much leverage will eventually bring a reduction of expected compounded return in a multi-period setting.
Allocating the Risk Budget
Comparative Sources of Risk, Drivers of Return
| Factor Diversified | Sector Rotator | |
|---|---|---|
| Number of securities | High (in the hundreds) | Low (in the tens) |
| Position concentration | Low | High |
| Cash positions | Very low | High when allocated to cash |
| Market beta | Close to one (diversified) | Higher/lower than one depending on risk targets |
| Absolute risk | Lower | Higher, though tempered by large allocation to cash |
| Active risk | Lower | Higher due to large idiosyncratic risks coming from concentrated positions and sector bets |
| Active Share | Lower | Higher, consistent with higher security concentration |
| Average sector deviation | Lower | Higher, consistent with willingness to take sector bets |
| Source of risk: market | Higher | Lower, consistent with higher security concentration |
| Source of risk: sectors | Lower | Higher, consistent with sector bets |
| Source of risk: styles | Lower | Higher, consistent with concentrated positions |
| Source of risk: unexplained | Lower | Higher, consistent with sector rotation and concentrated positions |
Additional Risk Measures
Risk constraints can be classified as heuristic or formal.
- Heuristic risk constraints are based on experience or general ideas of good practice. Examples include limits on exposure to individual positions, sectors or regions, limits on leverage, or measures designed to control the degree of illiquidity and turnover in the portfolio.
- Formal risk constraints are often statistical in nature. Examples include limits on volatility, active risk, skewness, drawdowns, and VaR-based measures including:
- Conditional VaR (CVaR)—the expected loss given VaR has been exceeded (also called expected tail loss or expected shortfall).
- Incremental VaR (IVaR)—the change in VaR from adding a new position to a portfolio.
- Marginal VaR (MVaR)—the impact of a very small change in position size on VaR.