Independent vs Dependent Variables
Regression modeling allows us to study the effects of independent variables on the subject variable called the dependent variable. The independent variables may also be called the “explanatory” or “input” variables. The goal of regression analysis is to analyze the relationship between the input variables and the dependent, or “response” variable.
Regressions can involve one independent variable, which is a linear regression model, or multiple independent variables, which would be a multi-variable regression.
Correlation, Covariance, Standard Error
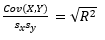
Correlation and correlation squared are the central outputs of a regression that we are interested in.
Correlation or R is the numerical expression of a relationship between a dependent and independent variable. It ranges from -1 to 1, where -1 represents a perfect negative or inverse relationship and 1 indicates a perfect positive or same-direction relationship. A correlation value of 0 means no exists relationship based on a linear model.
- Correlation Coefficient = r =
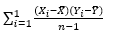
- Covariance(X,Y) =
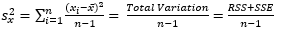
- Sample Variance =
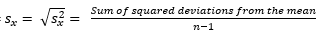
- Sample Standard Deviation =
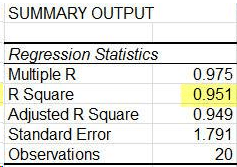
The R2
The R2 value is the also called the coefficient of determination. It is a numerical representation of how well the values tested fit the regression equation. With an R2 value of 0.40, for example, you could say that 40% of the movement in the independent variable explains movement in the dependent variable.
For multi-variable regressions, there is an also the adjusted R2 value, which adjusts for the number of independent variables and polynomials you are considering in the regression. This is done to solve two issues with an unadjusted R2 value:
- Adding additional inputs will always increase the R2, regardless of model
- As the number of predictors and polynomials increase, noise increases in the model
The standard error, or standard deviation is the square root of the variance of the model. The standard error is the average distance that the observations fall from the model’s regression line. In calculation, the variance will be used to prevent negative distances canceling positive distances in the averaging process. However, squaring the differences changes the unit of the variance from the unit of the model, as well as skews the variance towards the outliers. The root of the variance is the standard error, and helps restore the unit to the model specification.
This is an example of a normal table output of a regression. Note that observations is n.