
Coefficient values in multiple regressions are not informative on their own. To determine the significance of slope coefficients in multiple regression we need to conduct a hypothesis test to see if the values differ from zero and actually contribute to explaining variations in the dependent variable.
To do so we use the following t-statistic calculation.
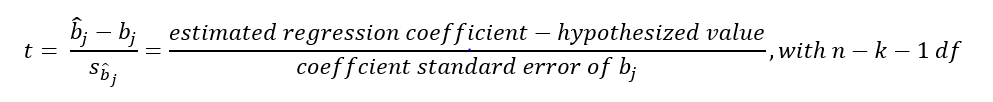
K is the number of regression coeffecients in the regression, n is the number of observations used.
For the significance test, we must create a null and an alternative hypothesis.
“testing statistical significance” ⇒ H0: bj = 0 versus Ha : bj ≠ 0
If the t-stat is greater than the critical value, we reject the null hypothesis, meaning the regression coefficient has explanation value. Otherwise we accept the null.
When testing for equality hypothesis (null: coefficient equals 0 and alt: coefficient does not equal 0) we want to use a two-tailed distribution. When testing comparisons, we can use a one-tailed distribution (null: intercept is less then 5% and alt: intercept is greater than or equal to 5%)
T-tests and p-tests will provide the same answers so use p tests if it’s provided. The p-test follows two simple rules:
- If the p-value is less than significance level, the null hypothesis can be rejected.
- If the p-value is greater than the significance level, the null hypothesis cannot be rejected.