
The next concept we will look at is significance testing. Significance testing is a form of hypothesis testing focused on linear regression outputs.
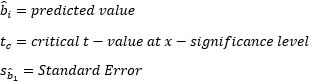
Hypothesis testing is using a test statistic to determine the probability that a hypothesis is accepted or rejected. We determine the probability using prediction intervals. The basic format of hypothesis testing is such:
- Null Hypothesis: Value is explained by model
- Alt Hypothesis: Reject null hypothesis
- T – test statistic = T-Test Formula = Coeffecient/Standard Error =

- Confidence interval = predicted value + (critical value)(standard error of forecast)
- Where predicted value could be sample mean
- Confidence Intervals:

-
Where:
-
- Confidence Interval = Critical Value at Significance Level
The critical value is determined by our desired accuracy level. A five percent, two tailed t-statistic has a critical value of 1.96. If the value created by our test statistic lies within the 1.96 confidence interval, then we say the null hypothesis is valid. Otherwise we reject the null hypothesis.
For example – lets take a t-test stat of 1.5. The 5% Confidence interval = -3 to 2. Thus we accept that the value of the test stat has a 95% chance of being explained by the model, and we accept the null hypothesis.
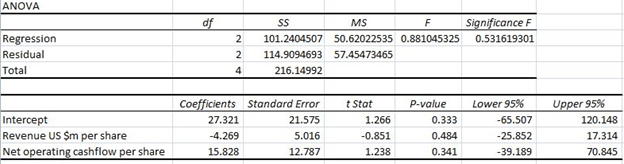
Taking this back to the ANOVA, we see there are two test statistics that are usually presented – the F-test, the T-Test, as well as a p-value for each of these.
The F-test is for the significance of the model, in other we test the significance of each coefficient at once.
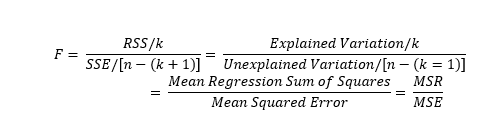
The T-test allows us to test for the significance of each individual coefficient.
The test we are conducting asks whether the coefficient values are significantly different from 0. The F-test tests a null hypothesis that all the coefficients equal zero. If we reject the null hypothesis, this means that at least one of the coefficients is significantly different from zero, and therefore significantly contributes to the explanation of the dependent variable. The t-test is the same concept but on a coeffecient level instead of the model level.
The p-value is a further check on our test statistics. The p-value is a probability that indicates the likelihood that our test statistic would be generated when the null hypothesis is true.
Let’s say we reject the null hypothesis based on an F-test value of 230, where the critical value is 160. If we have a P-value of .001, that means that there is a 0.001% chance that we would generate a F-test value of 230 under circumstances where our regression coefficients did equal zero. In other words, there is a 0.001% chance that we have incorrectly rejected the null hypothesis. However, if the p-value where .85, this would indicate an 85% chance that the value 230 could be generated when our coefficients equal zero, which would lead us to question our model’s validity.
In short, a low p-value agrees with rejecting a null hypothesis, while a higher p-value favors the null hypothesis.